
T Test
Strictly speaking what we are about to show you how to do is a z test for unmatched data. We want to keep things as simple as we can and as far as examinations boards are concerned this is a T test.
This test is used to determine whether the arithmetic means of two sets of data are significantly different to one another. You need 25+ items of data in each data set and strictly speaking it should be used with interval data only. If you have big data sets it can however be used for count-data. It assumes that the data is normally distributed (symmetrical about the mean)
 I
f you were to ask the question "Is the mean height of people
in Y Cwm Gwyn significantly different to the mean height of people
in Caerdydd; you would find it easy to answer "yes".
The shortest person in Y Cwm Gwyn is taller than the tallest person
in Caerdydd. There is no overlap, they are significantly different
I
f you were to ask the question "Is the mean height of people
in Y Cwm Gwyn significantly different to the mean height of people
in Caerdydd; you would find it easy to answer "yes".
The shortest person in Y Cwm Gwyn is taller than the tallest person
in Caerdydd. There is no overlap, they are significantly different
 If
you were to ask the same question about people in Caerdydd and
people in Hwlffordd; the answer is not so clear. The means are
much closer together and there is considerable overlap between
the two sets of data. A T test allows you to answer the question
"Are these two means significantly different or not?"
It takes into account the differences between the means and the
amount of overlap of the two sets of data. The null hypothesis
for every T test you will ever do is this:
If
you were to ask the same question about people in Caerdydd and
people in Hwlffordd; the answer is not so clear. The means are
much closer together and there is considerable overlap between
the two sets of data. A T test allows you to answer the question
"Are these two means significantly different or not?"
It takes into account the differences between the means and the
amount of overlap of the two sets of data. The null hypothesis
for every T test you will ever do is this:
"There is no significant difference between the means of the two sets of data"
To perform a T test we need to know three things about each set of data:
The number of items in each data set (n) (count them).
The mean: Add up all the individual items of data and divide by the number of items of data. (= sigma x divided by n)
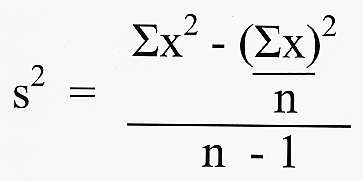
The variance (a measure of the spread of the data about the mean): Proceed as follows:
1) Add up all your data (you've just done this to work out the mean) and square the total (= Sigma x-squared)
2) Square each item of data individually and add them up (= (sigma x)-squared)
3) Stick the numbers in this formula and punch the appropriate keys on your calculator: (this is where most people go wrong but we're not going to give you an arithmetic lesson)
 n is the number
of items of data
n is the number
of items of data
Do this for both sets of data and you are in the happy position of being able to calculate the value of T that is specific to your data (the calculated value).
Do this using this formula:
 this may look a bit scary if you've
not seen it before but do not panic, a worked example will follow:
this may look a bit scary if you've
not seen it before but do not panic, a worked example will follow:
Let us suppose that you are conducting an investigation into the weight of people in a school. Half the subjects are boys and half are girls. You think that the boys might have a significantly bigger mean weight than the girls. You weigh all the individuals and come up with the following information:
Mean weight (boys) = 54 Kg, variance = 16 (number of measurements = 25)
Mean weight (girls) = 47 Kg, variance = 19 (number of measurements = 25)
Calculate the value of T for these two sets of data:
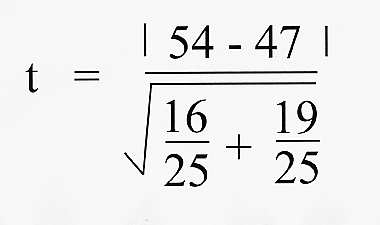 The two vertical
lines mean "ignore the sign of the top number". It's
the magnitude of the number that counts not whether it is positive
or negative. Now proceed as follows:
The two vertical
lines mean "ignore the sign of the top number". It's
the magnitude of the number that counts not whether it is positive
or negative. Now proceed as follows:

Our calculated value for t is 5.93.
All we have to do now is compare this with the critical value which we get from a table of critical values of t prepared for us by cunning statisticians. Here is such a table:
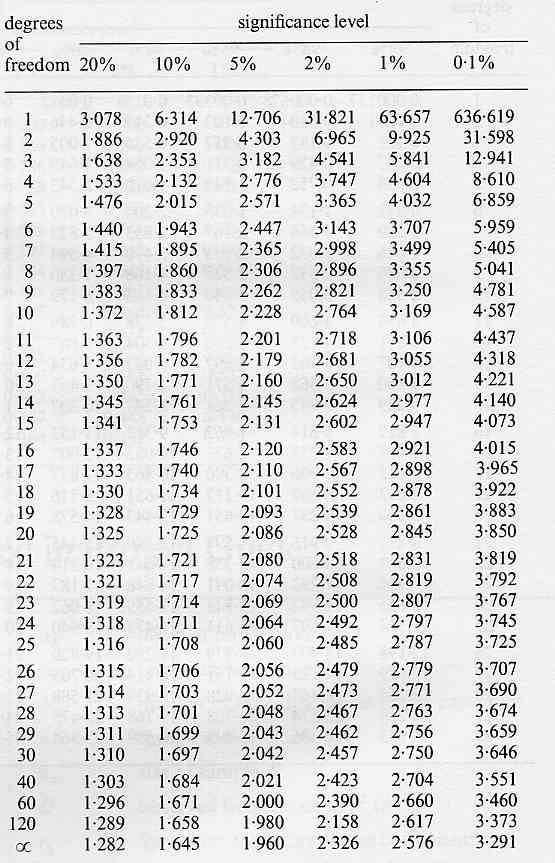 First work out how
many degrees of freedom (for a t test this is the total number
of pieces of data minus 2). In our case this is (25 + 25) - 2
= 48. Enter the table at the nearest number
of degrees of freedom to yours. If you're between two values always
take the lower one. This makes it harder for us to beat the critical
value and thus represents a cautious approach. Our appropriate
entry point is therefore 40 degrees of freedom.
First work out how
many degrees of freedom (for a t test this is the total number
of pieces of data minus 2). In our case this is (25 + 25) - 2
= 48. Enter the table at the nearest number
of degrees of freedom to yours. If you're between two values always
take the lower one. This makes it harder for us to beat the critical
value and thus represents a cautious approach. Our appropriate
entry point is therefore 40 degrees of freedom.
Next you have to decide how precise you wish to be in your acceptance or rejectance of your null hypothesis. Usually we will pick 5% (see section on "The structure of hypothesis testing statistics" if you want to know more about this).
Workig down the 5% column and across the 40 degrees of freedom row we get a critical value of 2.021
Our calculated value is 5.93
5.93 is bigger than 2.021. In a t test if our calculated value is bigger than the critical value we reject our null hypothesis. In rejecting our hypothesis of no difference we are saying that there is indeed a significant difference between the means of the two sets of data. In choosing the 5% significance level we are saying that we would expect to be coreect in accepting or rejecting our null hypothesis 95% of the time. We might get a different result due to chance 5% of the time.
Loose talk about such matters can cause spontaneous combustion in real statisticians but here goes anyway: It's sort of like saying that you are 95% that you are correct in rejecting the null hypothesis (or accepting it if your calculated value is smaller than the critical value).
Looking for a next step?
The FSC offers a range of publications, courses for schools and colleges and courses for adults, families and professionals that relate to the seashore environment. Why not find
out more about the FSC?

FEEDBACK
Do you have any questions?
Copyright © 2008 Field Studies Council

Creative Commons Attribution-Noncommercial-No Derivative Works 3.0 Licence .
Site Statistics by Opentracker